TPP · transient spectra and recovery
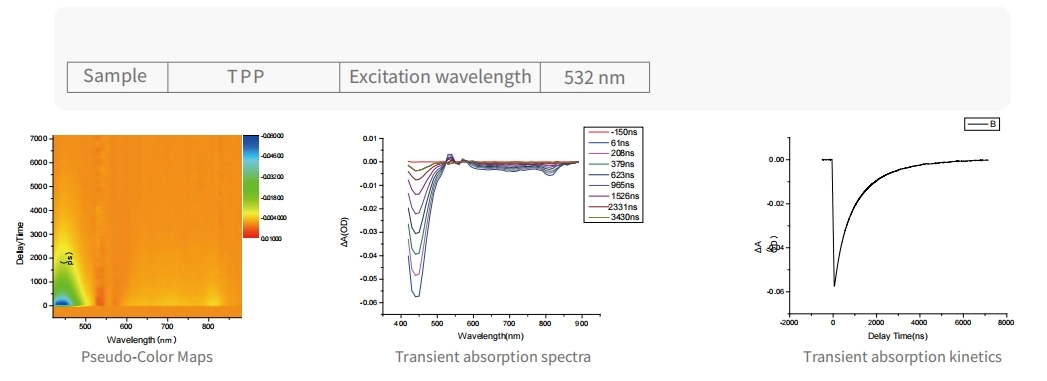
The map, spectral slices and kinetic curve show complementary views of the transient response. The sample and excitation below follow the labels within the original figure.
Sample labelled TPP · 532 nm excitation. Concentration, solvent and pump fluence are not stated in this figure.